Data
I analyzed the National Obesity by State. Here is a link to my spreadsheet with the data, pivot table, and graph.
Trend
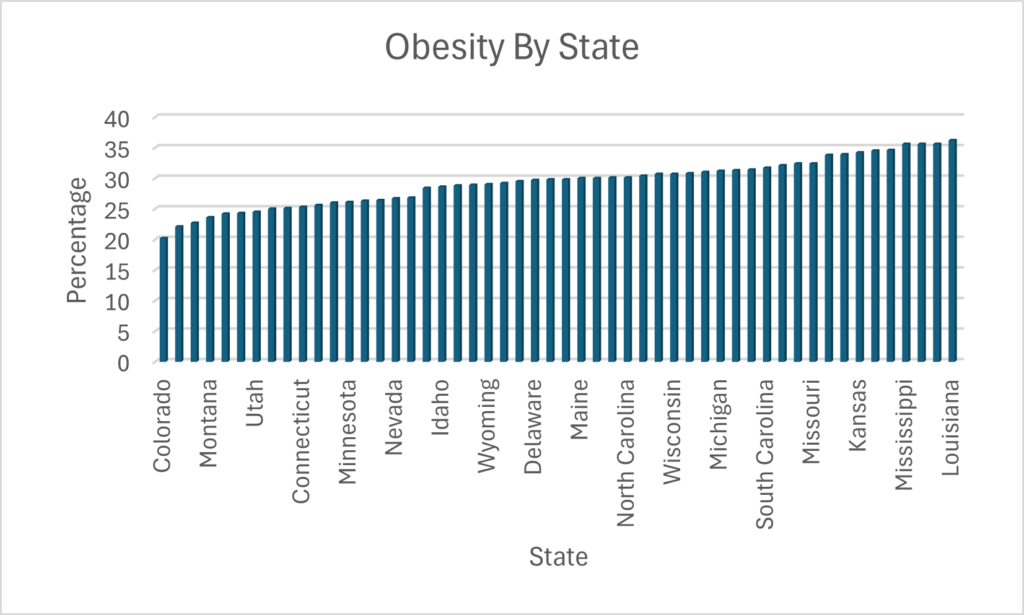
The states with the lowest obesity percentage are primarily the mid west and northeast states. The top 11 states with the highest obesity percentage are in the south.
Process
I used Microsoft excel to format and analyze the data. I created a pivot table with the information I needed for the graph, which was state and percentage, and then sorted the data from lowest percentage to highest. I then created a graph from that table in order to see a trend.
0 Comments